Saturday, 27 January 2018

Quibans 79: Nutella Riots

From the BBC:

Nutella 'riots' spread across French supermarkets


A discount on Nutella has led to violent scenes in a chain of French supermarkets, as shoppers jostled to grab a bargain on the sweet spread.
Intermarché supermarkets offered a 70% discount on Nutella, bringing the price down from €### (£3.90) to €1.40.
But police were called when people began fighting and pushing one another.
Some 365 million kilos of Nutella, a hazelnut chocolate spread, is consumed every year in 160 countries around the world.

Here is information about Nutella from the Tesco website:
  • Pack size: 750g

Ingredients

Sugar, Palm Oil, Hazelnuts (13%), Fat-Reduced Cocoa (7.4%), Skimmed Milk Powder (6.6%), Whey Powder (Milk), Emulsifier: Lecithin (Soya), Vanillin

50 Portions per jar = 50 x 15g


What can we work out?  Some ideas are below.

.

.

.

.


Q1)  Work out the missing number
Q2)  What is the exchange rate?
Q3)  How many portions are sold each year?
Q4)  How many tonnes of Nutella are sold each year?
Q5)  How many kg of hazelnuts/coca/milk are used each year?
Q6)  Ingredients are listed in order (highest amount to lowest).  What is the smallest percentage of sugar there could be?


Answers
Q1)  Intermarché supermarkets offered a 70% discount on Nutella, bringing the price down from €4.50 (£3.90) to €1.40.
This is interesting because if you do 1.40/0.3 you get 4.67
There has been some rounding going on!  The actual discount is 68.9%
Q2)  £1 = €1.15
Q3)  365 million kg divided by 15g = 24 billion servings.  (That's more than 3 servings per person on the planet)
Q4)  365,000 tonnes  - that's 1000 tonnes per day!
Q5)  Hazelnuts - 47,000 tonnes, Coca - 27,000 tonnes, Milk powder - 24,000 tonnes
Q6)  If the smallest three ingredients are the biggest they can possibly be then they will each be 6.6% and the total of everything other than sugar and palm oil is 46.8%.  The smallest the sugar can be is half of what remains, which is 26.6%.  In reality this is likely to be a big underestimate.


Sources: www.bbc.co.uk/news/world-europe-42826028

https://www.tesco.com/groceries/en-GB/products/250838346

Tuesday, 16 January 2018

Quibans 78: Expensive wine

In my Spanish class we read a newspaper article about the most expensive wine in the world.  Here is my translation of part of that article:

This is the most expensive wine in the world and it’s made in Spain.
Each bottle of AurumRed ‘gold series’ costs €25,000.  Hilario García produces 300 of these bottles per season, of which he sells 150 immediately and reserves the rest for repeat clients, and there are some of them.
The cellar also produces 6,000 bottles per year of the ‘silver series’, at €2,200 per piece and 3,000 bottles of sauvignon blanc, which is much more accessible at €30.

Questions:
1)      What is the average cost of a bottle of wine from this vineyard?
2)      Comment on the usefulness of this answer


Translation: MD

Original text:
Así es el vino más caro del mundo, que se hace en España
Cada botella de AurumRed serie oro cuesta 25.000 euros.  Hilario García produce al año 300 de estas botellas, de las que comercializa 150 por temporada, y reserva el resto para los clientes que quieren repetir, que los hay.

De la bodega salen también 6.000 botellas al año de la serie plata, a 2.200 euros la pieza, y 3.000 de sauvignon blanc mucho más asequibles, a unos 30 euros.

Wednesday, 10 January 2018

Quibans 77: Brussels Sprouts at Lidl

On the radio this morning they reported:
Lidl supermarket said it had record UK sales in December, with a rise of 16% on the same period in 2016.
Customers bought about #### tonnes of Brussels sprouts.


I told my class this and said that the first digit of the number of tonnes of sprouts was a 6.  They then worked out a likely number.

What they did is below.
.
.
.
.
.
.
.
.
.
.
.
.
Here is one solution.  Others were shared too.
  • Assumption: 1 sprout weighs about 10g.  We know that 1 tonne = 1 million g, so this is 1/100,000 of a tonne.
  • Assumption: Each person in the country has 5 sprouts at Christmas.
  • Assumption: There are 64 million people in the country.

Multiplying these gives a total sale of 3200 tonnes of sprouts.
Some people buy these from supermarkets (and there are lots of these: Tesco, Sainsburys, Morrisons, Asda, Waitrose, Lidl, Aldi, M&S, Co-Op, Spar), some from local shops and others will grow their own.
Those studying business studies predicted that Lidl might have approx 10% market-share.  
We assumed that this meant they sold 10% of the sprouts too (this is an assumption we need to make.  For example, Iceland (the shop) has more frozen food, so their market share couldn't be used to predict sales for fresh produce).
Lidl would therefore sell 320 tonnes of sprouts.

The next part is the thing I found particularly interesting.  The students pointed out that 320 tonnes was almost exactly midway between 60 tonnes and 600 tonnes.  The halfway point is 330 tonnes.  The students were aware that in an answer as full of estimates as this they couldn't say that their 320 is less than 330 (which is right and sensible), but they were unclear whether they should round up to 600 or round down to 60.

After discussion they were happy with the idea that we usually think in a multiplicative way about our errors in a question like this (so we predicted 5 sprouts per person, but it could have easily been double that).  To get to 600 you multiply by a number less than 2, whereas if you divide by 5 you haven't reached 60.  They decided on 600 tonnes as the answer.

Here is the start of the story (from the BBC News site):
Lidl supermarket said it had record UK sales in December, with a rise of 16% on the same period in 2016.
Customers bought about 600 tonnes of Brussels sprouts

Sunday, 31 December 2017

Quibans 76: Away matches

During the Christmas period (the weekend before Christmas, up until just into the New Year) the Premier League football teams play four games.  BBC Sport website had this as a headline:

Premier League festive fixtures: Which clubs have toughest schedule?

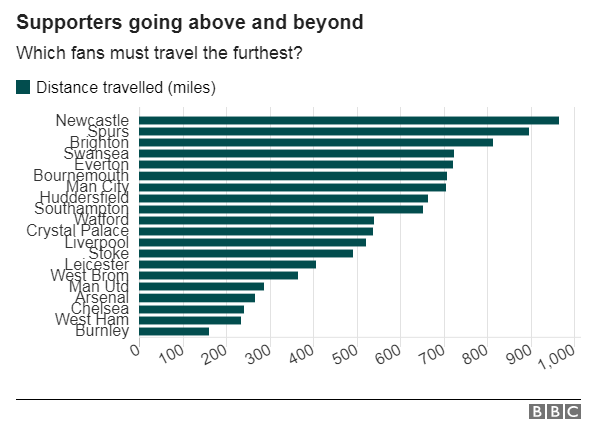
As part of this they looked at how far supporters of each club would travel if they attended all four games.  (Distances are measured by road from the stadium of their own club.) 

Q1) Across the whole season, which team's supporters would you expect to travel the furthest?  Which would travel the least?

Here are the teams and a rough indication of where they are
Arsenal   (London)
Bournemouth   (South coast)
Brighton and Hove Albion   (South coast)
Burnley   (North west)
Chelsea   (London)
Crystal Palace   (London)
Everton   (North west)
Huddersfield Town   (North west)
Leicester City   (Midlands)
Liverpool   (North west)
Manchester City   (North west)
Manchester United   (North west)
Newcastle United   (North east)
Southampton   (South coast)
Stoke City   (Midlands)
Swansea City   (South Wales)
Tottenham Hotspur   (London)
Watford   (London)
West Bromwich Albion   (Midlands)
West Ham United   (London)

Here is a map of the teams (taken from awaydayplanner.com, with the teams highlighted in blue). 

Q2)  Do you want to change your answers?  (NB: Liverpool and Everton are so close together that they appear as a single dot here.)

In the article this graph was included:

Q3)  What sort of correlation do you think there is between the distance travelled during the Christmas period and that travelled during the whole season?  Can you predict the pmcc?

Here are the figures (taken from a Talksport article, from awadayplanner and from the BBC).  The spreadsheet can be downloaded here.


Answers/thoughts

It might initially appear that all teams will travel the same distance to play each other, but further reflection suggests that teams that are closer to the middle of the country are likely to travel the least.
There are several ways to think about this.  There are six teams in London.  Their journeys to play each other will be quite short, but for Newcastle to play each of the six London teams they will need to make six long journeys.

One way to convince yourself that clubs on the periphery are likely to travel furthest (Eg Newcastle, Swansea, Burnley, Brighton) is to go to ridiculous extremes.  If Pluto United joined the premier league then for one game each season the other 19 clubs would travel once to Pluto.  But the fans of Pluto United would have to travel to Earth 19 times to play each of their away games.

In all of this we are making the assumption that each match is a self-contained trip.  It might be possible for Newcastle fans to make a single trip to London and to stay there for all of the London matches, but in practice this will mean living in London for the season, because football teams rarely play two matches in three days and usually (roughly) alternate between playing a match at home and then one away.

The table for Q3 shows the clubs in order.  I had predicted that Newcastle and Swansea would be the two clubs with the furthest journeys and that a north London club would have the shortest journey in total.

Burnley were particularly fortunate with their festive travel distances.  Tottenham Hotspur were a bit hard done by. 
The pmcc is 0.52 - indicating a weak positive correlation.


Sources:
http://www.bbc.co.uk/sport/football/41812290
http://awaydayplanner.com/
https://talksport.com/football/how-far-fans-every-premier-league-club-must-travel-next-season-least-most-distance

Wednesday, 20 December 2017

Quibans 75: Don't Panic!

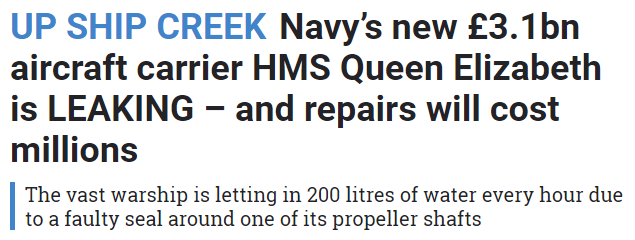
This story appeared in most newspapers.  The Sun put it like this:


200 litres every hour!  Clearly letting in water isn't ideal for a ship, but is 200 litres a lot?

How long before it will sink?

Some data here (from the Daily Telegraph) might help:


Some thoughts/answers:
I googled the capacity of a standard bath-tub.  It appears that 120 litres or 150 litres are fairly common capacities.
To put this into perspective: it's letting in about one and a third bath-tubs of water per hour.  That doesn't seem very much!

A length of 920 feet, beam of 230 feet and draught of 36 feet are given in the Daily Telegraph graphic.  I assume that 'beam' means the width of the ship and that the 'draught' is the amount of ship under the waterline.  There is a lot of aircraft carrier above the waterline, but if we find the rough volume of ship underwater (treating it a cuboid) then we would get 920*0.3 * 230*0.3 * 36*0.3, which is about 200,000 cubic metres.  That's 200 million litres.

At 200 litres per hour that is a nice round million hours before the part currently below the waterline to fill with water.  It will take just over 100 years for this to happen.  So if left untreated, if it still exists in a hundred years, if no-one uses a pump, and if the navy runs out of buckets for bailing purposes, then the ship will probably be in trouble early in the 22nd century.


Sources:
https://www.thesun.co.uk/news/5168494/hms-elizabeth-leak-navy-repairs-millions/
http://www.telegraph.co.uk/news/2017/12/18/hms-queen-elizabeth-britains-new-31bn-aircraft-carrier-has-leak/


Thursday, 7 December 2017

Quibans 74: Parking fines

The article below is excerpted from the Cambridge News website (link at the foot of the page).
Read the article, carry out some calculations and comment on the substance of the article.  Some of my ideas follow the article (after a jump).

Where you are most likely to get a parking ticket in Cambridge

One Cambridge road has seen more drivers slapped with parking tickets than any other, new data has revealed.  If you park regularly on Chesterton Road, to the north of the city centre, you may well have seen parking wardens issuing yellow tickets as it is the number one place to get a ticket in Cambridge.
The fining hotspot was revealed after a Freedom of Information Request by insurance comparison website comparethemarket.com, which has detailed an interactive map with its findings.
The data also shows Cambridge was the top city in the East of England for parking fines, with twice as many handed out in the city over three months compared to the next ranking area.
Cambridgeshire County Council issued a total of 12,234 penalty charge notices between July and September 2017, making £281,025 of revenue.
But the region's second parking fine hotspot - East Hertfordshire - lagged behind with 6,950 fines on motorist's vehicles generating a revenue of £191,878.
Simon McCulloch, director at comparethemarket.com said: "Our parking fines hotspots have revealed that motorists need to be extra vigilant when it comes to something as simple as parking their vehicle correctly if they want to avoid a hefty fine.  If you do find yourself with a PCN, it’s worth checking your ticket, as you can often reduce the fee by half, simply by paying it within 7 or 14 days, depending on your local council."

The top 10 parking fine areas in East of England

1. Cambridge (12,234) - £281,025
2. East Hertfordshire (6,950) - £191,878
3. Watford (6,428) - £136,818.69
4. Norwich (5,719) - £171,570
5. St Albans (4,963) - £132,570
6. Colchester (4,791) - £91,220
7. Ipswich (4,551) - £107,044
8. Welwyn Hatfield (3,599) - £79,650
9. Dacorum (2,800) - £90,459
10. Basildon (2,365) - £74,746

Write down comments about the article above before scrolling down to see what I have written.

.

.

.

.

.

.

.

.

.

.

.

.

.

Here are a few ideas.  These are not necessarily complete - there are likely to be other things that can be worked out too.

First of all, it doesn't seem sensible to draw a pie chart (the whole pie would refer to the number of fines or the amount of money from only the top 10 places).  A bar chart might show this well.  A scatter graph would show the relationship between the number of fines (given in brackets) and the amount of money collected.

It is clear that the ranking has been carried out on the number of fines rather than the amount of money, because the former goes down in order whereas the latter jumps around a bit.

We could work out the correlation coefficient and finding that this is 0.95 we could comment that there is a very strong positive correlation between the number of fines and the amount of money paid in fines.  This is perhaps unsurprising.

The 69 pence involved in the Watford total looks a little strange!

The spreadsheet below shows the amount of money per fine.  Presumably the 'money per fine' is not a round number in most cases because fines are different in car parks and on the side of the road and because you get a discount if you pay quickly.  


This makes the Norwich figure of exactly £30 per fine look a little odd.

I followed the link in the article and found the original data.  Here is the section for the East of England:


First of all, this is in alphabetical order of location!  Surely actually ranking them would be more sensible?
Then we have the 'location' which, as per the article, is presumably the location with the most fines.
Finally - have a look at the Norwich revenue!  This wasn't disclosed for some reason.  

The author of the Cambridge News article appears to have decided to assume all of the Norwich fines were £30.  I find it a bit galling that they didn't disclose that in the article.
Maybe a better way to do this would be to use the average of the fines in other places, or to look at the highest and lowest and to give an upper/lower bound?

Final problem with this article and this research is that not all the places listed are the same size!  It would make sense to factor in the population or the number of cars or the number of visitors rather than using the raw figures.

Oh - and last thought: the first sentence is surely trivially true?  Unless there is a tie then it will always be the case that "One Cambridge road has seen more drivers slapped with parking tickets than any other" !


Saturday, 18 November 2017

Quibans 73: Food waste

Here are excerpts from four Guardian articles, all from 2017. The original headlines are shown in bold.

Nearly half of all fresh potatoes thrown away daily by UK households

Nearly half of the edible fresh potatoes bought by UK householders each day are thrown away - 5.8 million of them per day, and at a “staggering” annual cost of £230m, figures show.

The humble spud is the second most wasted food in the UK, behind bread, according to campaign material released on Wednesday. The research was offered in support of a government campaign to encourage consumers to reduce their domestic food waste.

The UK churns out 10m tonnes of food waste a year – of which 7.3m tonnes come from households. The estimated retail value of this is £13bn, and Wrap calculates that a typical family wastes £700 of food a year.

Britons to throw away £428m worth of barbecue food in August, study reveals

It’s symbolised by dismal burgers and carbonised sausages served on paper plates with a splatter of ketchup. Yet with the great British summer well under way, Britons are this month set to throw away a staggering £428m worth of barbecue food, research reveals.

In August the nation will brave the changeable weather to enjoy nearly 12m barbecues, with people on average either hosting or attending at least two of the seasonal gatherings. The new research from supermarket chain Sainsbury’s shows that hosts typically over-cater to impress friends and family, with more than half (49.2%) putting on a larger than necessary spread.

Salad leaves, burger rolls, hot dog buns, coleslaw and potato salad are the top five food items most likely to be wasted during barbecue season, the research found, amounting to £36.47 worth of food waste at each event. The total does not include drink.

Salad days soon over: consumers throw away 40% of bagged leaves

Britons throw away 40% of the bagged salad they buy every year, according to the latest data, with 37,000 tonnes – the equivalent of 178m bags – going uneaten every year.

UK throwing away £13bn of food each year, latest figures show

An estimated 7.3m tonnes of household food waste was thrown away in 2015 – up from 7m tonnes in 2012.

UK households binned £13bn worth of food in 2015 that could have been eaten, according to new figures which suggest that progress in reducing the national food waste mountain has stalled.

Of the food thrown away, 4.4m tonnes was deemed to be “avoidable” waste that was edible at some point before it was put in the bin or food waste caddy – such as bread that goes mouldy – compared with 4.2m tonnes in 2012. The rest were scraps that could not be eaten such as meat bones, eggshells, tea bags, coffee grounds, apple cores and fruit and vegetable peelings.

That meant the average UK household wasted £470 worth of food, which went in the bin when it could have been eaten. The avoidable food waste generated 19m tonnes of greenhouse gases over its lifetime – and preventing that pollution would be equivalent to taking one in four cars off UK roads, Wrap said.


Here are some possible questions:
  1. How much does one potato cost?
  2. How much does a kg of food cost?
  3. According to the figures in the first article, how many families are there in the UK?
  4. What errors/inconsistencies are there in the articles?
  5. How do the figures in the BBQ article fit together? 
  6. How much does one bag of salad weigh?
  7. How many bags of salad are bought each year?


Sources:
https://www.theguardian.com/environment/2017/nov/08/nearly-half-of-all-fresh-potatoes-thrown-away-daily-by-uk-households
https://www.theguardian.com/environment/2017/aug/16/britons-to-throw-away-428m-worth-of-barbecue-food-in-august-study-reveals
https://www.theguardian.com/environment/2017/may/24/salad-days-soon-over-consumers-throw-away-40-bagged-leaves
https://www.theguardian.com/environment/2017/jan/10/uk-throwing-away-13bn-of-food-each-year-latest-figures-show

Quibans 111: How much energy and water do our AI tools really use?

Here is how I used the article below from the Times.  Before showing the article, I started with this information and these questions: Mic...