Thursday, 29 September 2022

Quibans 106: Which animals could you beat in a fight?

This is based on a survey carried out by the (usually reputable) polling organisation YouGov.  Here is my suggestion of how to use this as a lesson.

The lesson materials (but not the answers) are also available on this PowerPoint

I gave out a questionnaire first:

Fight!

Which of the following animals, if any, do you think you could beat in a fight if you were unarmed?

Rat


Lion


House cat


Gorilla


Medium sized dog


Chimpanzee


Large dog


King Cobra


Kangaroo


Elephant


Eagle


Crocodile


Grizzly bear


Goose


Wolf


Which order do you think people will put them in overall?

(easiest to beat = 1, hardest = 15)


Collect the data as a class.  How representative is the sample?  Will our data reflect the national data well? 


Here is an article from Newsweek (a US news magazine): 

A Surprising Number of Americans Think They Could Beat Wild Animals in a Fight

A 2021 YouGov survey had revealed that a surprising number of Americans think they could win an unarmed fight against a variety of wild animals.

Reassuringly, the percentage of Americans confident about winning an unarmed fight goes down, the larger the animal.

Most Americans—72 percent—believe they could beat a rat in a fight, which despite the rodent's large teeth, could perhaps be feasible. However, some foolhardy people still believe they stand a chance against some of the scariest animals in Animal Kingdom, such as the grizzly bear, and the crocodile.

It is a criminal offense to hurt animals. Animal cruelty is a federal crime. The animals mentioned below are generally of no threat to humans unless provoked.

Could You Beat a Bear in a Fight?

Americans are not confident in their abilities to beat a grizzly bear in a fight. Only 6 percent believe that they could win. Grizzly bears can stand at a height of up to 8 feet, and the males can weigh up to 1,700 pounds.

They are faster, stronger, better equipped with both teeth and claws, and they have a much higher level of protection with thick fur, skin, fat layers and thicker stronger bones. So both offensively and defensively we are no match for them.

Could You Beat a Crocodile in a Fight?

A bold 9 percent of Americans think they could take on a crocodile, the biggest reptile in the world. Some can reach 20 feet. Males over 17 feet weigh from about 1,760 pounds to 2,200 pounds. Considering that one of the strongest men in the world, Iranian weightlifter Hossein Rezazadeh, was able to lift only 579 pounds, you can see what you're up against.


Possible questions:

Q1) How does your personal order compare with the national figures for the USA?

Q2) How does the class percentage compare with the USA figures?

(What types of correlation might be useful here?)

Q3) In the Newsweek article, what is unusual about the units that are used? 

Q4) Covert the units to metric.

Q5) How do you think people in the UK will compare to those from the US?


Answers:

A1&A2) It may be useful to use Spearman’s Rank Correlation Coefficient for Q1 (to compare the rankings of the animals), and the PMCC for Q2 to compare the percentages.  It seems unlikely that the percentages will be close, because in class we have such a small sample size, and it may not be a representative sample because everyone is roughly the same age and lives in roughly the same place.

A3)  The article says Grizzly bears are 8 feet tall and weigh 1700 pounds.  The units are what we would call “imperial units” and which are used in the USA.  They call them “units”, “British units”, or “customary units”.

A4)  1 foot is approx 30cm, so 8 feet is about 2.4m. 

1700 pounds (1700 lb) can be converted as follows:  There are 14 pounds in a stone and 1 stone is about 6.4kg.  Alternatively, use 2.2 lb = 1kg. 

The bear is about 120 stone (!), or 770kg.

For the crocodile, 20 feet is about 6 metres, and 2200 lb is approx 1000kg, which is 1 tonne. 

Hossein Rezazadeh can lift about 260kg.


Now show the table below from the original YouGov data:

Q6) Which figure was used in the graph?


A6) The 72% was used.  (Is it reasonable to lump the ‘don’t knows’ in with ‘I could not beat…’?)


Here is one graph that was tweeted out:


Q7) Comment on the graph and the data.


A7)  Comments might include:

About twice as many Brits were asked compared to Americans.  The data was collected a month apart.   Brits were generally much more cautious!  For a rat the difference appears to be about 6%, and for a lion the difference appears to be about 6%.  But that means only a small fraction more Americans thought they could beat a rat, but that about four times as many thought they could be a lion. 

Here is a final graph about the same original data:
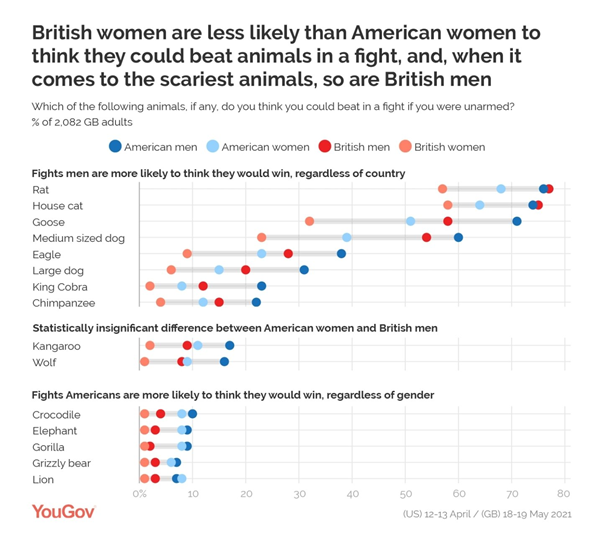
Q8) Comment on this graph

A8) Comments might include: Men are always more confident than women from the same country … except for the lion.

As the headline suggests, for the more dangerous animals, US women are more confident they could win than GB men.

Compare the cat and the rat data with the previous graph.  The GB men are the most confident group overall.  Does this change the way we might interpret the previous graph?


Final thoughts: We could return to the class data that was collected at the start of the lesson.  This Quibans shows the importance of: the sample size, the sample that is used and the way the data is analysed and presented. 

https://www.newsweek.com/surprising-americans-beat-wild-animals-fight-experts-1691793

https://yougov.co.uk/topics/society/articles-reports/2021/05/21/which-animals-could-britons-beat-fight

https://docs.cdn.yougov.com/mygotrlqrg/YouGov%20-%20Humans%20vs%20animals%20UK.pdf

https://docs.cdn.yougov.com/07vgk5e81j/YouGov%20-%20Human%20vs%20animal%20fight.pdf


Wednesday, 9 March 2022

Quibans 105: Ukraine

Below are excerpts from two Guardian articles.  This Quibans records the things my class and I did with the articles.

From The Guardian – 3 March 2022

Ukraine’s refugees: how many are displaced and where will they go?

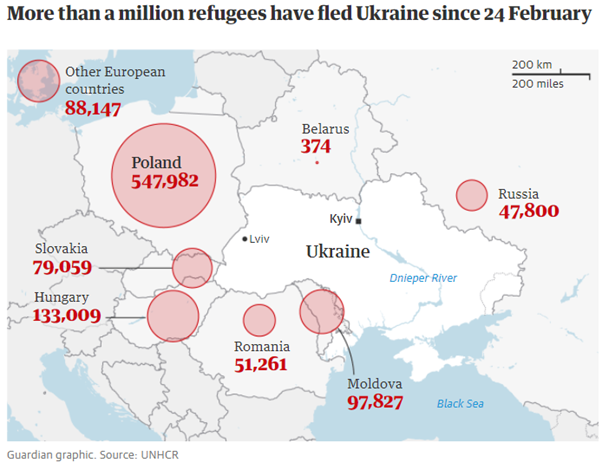
Domestic civilian flights were cancelled on the first day of the invasion. Since then, people have been heading west into neighbouring countries including Poland, Romania, Moldova and Hungary.

More than half – nearly 548,000 – have fled to Poland which shares a 500km border with Ukraine. A further 133,000 have gone to Hungary, 72,000 to Slovakia, 51,260 to Romania, and nearly 98,000 to non-EU Moldova, Europe’s poorest country. A small number, just over 350, have travelled to Belarus.

From The Guardian – 8 March 2022

Britain should refrain from criticising Ireland’s open-door policy towards Ukrainian refugees, an influential Conservative MP has said, after anonymous briefings claimed it was creating a security risk for the UK.
The Irish government minister Roderic O’Gorman told RTÉ’s Morning Ireland that giving shelter to refugees was “the right thing to do”, revealing that 2,200 Ukrainians had arrived in the country since Russia invaded on 24 February, compared with about 300 in the UK.

Possible questions:

  1. Comment on the countries refugees are going to.
  2. Are the numbers on the map and in the article consistent? 
  3. Are the numbers accurate?
  4. Which country is supporting the most refugees?  (Why is it not necessarily the ‘obvious’ answer of Poland?)
  5. What percentage of the refugees are in each country?
  6. What is the connection between the circles and the number of refugees?

.

.

.

.

.

.

Answers:

1) Comment on the countries refugees are going to.

Those listed are the countries immediately surrounding Ukraine.  This is not a surprise, because flights to/from Ukraine are not currently possible, so to leave Ukraine you need to enter a neighbouring country.  Many people will want to return home as soon as possible and won’t want to travel further. Some might have family in those neighbouring countries. Given that they are safe in those countries it would be understandable if people didn’t want to travel further.  The number of refugees in Belarus is tiny.  But Belarus is supporting Russia in their invasion. Perhaps a bigger surprise is the number in Russia; they are presumably ethnic Russians who were living in Ukraine.

2) Are the numbers on the map and in the article consistent? 

Largely, yes.  Rounding has mostly been carried out appropriately.  The only exception is that Slovakia’s figure from the map has been wrongly stated in the article.  Interestingly, almost all of the values have been rounded up.  The biggest round-down number is for Belarus!

3) Are the numbers accurate?

I have no idea!  How do you accurately count over a million people? The source for the data is the UNHCR (The United Nations High Commission for Refugees) and they presumably have a sensible and consistent methodology that they use in different countries.

The interesting ones are that three of the numbers end in 00, which perhaps suggests they have been given as approximations.  One of these is for Russia, which seems to make sense too, given that they are not cooperating with the international community particularly well at the moment ...

4) Which country is supporting the most refugees?  (Why is it not necessarily the ‘obvious’ answer of Poland?)

Maybe it would be better to compare the number of refugees to the population of each country? 

Here are some calculations that I carried out in Excel:


No. of refugees

Population

Refugees / population

% of the refugees

Poland

547982

37,846,605

0.014479027

52.42%

Slovakia

79059

5,459,643

0.014480617

7.56%

Hungary

133009

9,660,350

0.013768549

12.72%

Romania

51261

19,237,682

0.002664614

4.90%

Moldova

97827

4,033,963

0.024250842

9.36%

Russia

47800

145,934,460

0.000327544

4.57%

Belarus

374

9,449,321

3.95796E-05

0.04%

Other Europe

88147


8.43%


Ireland

2200

4,937,796

0.000445543

0.21%

United Kingdom

300

67,886,004

4.41917E-06

0.03%

Moldova has the most per population.  Slovakia is almost identical to Poland.  (We also discussed what the values for Belarus and the UK mean.)

5) What percentage of the refugees are in each country?

See the table above.

6) What is the connection between the circles and the number of refugees?

I copied the graph into GeoGebra and drew line segments to measure the approximate diameter of each circle.  When I divided the number of refugees by the area of the circle I got similar answers (roughly 160,000) each time, suggesting that the areas of the circles show the values.


Sources:

https://www.theguardian.com/global-development/2022/mar/03/ukraines-refugees-how-many-are-displaced-and-where-will-they-go

https://www.theguardian.com/world/2022/mar/08/uk-should-not-criticise-irish-policy-on-ukrainian-refugees-says-tory-mp


Sunday, 13 February 2022

Quibans 104: Basket Case

This Quibans comes from a BBC story (widely reported elsewhere too) about the rise in price of a basket of items.

Cost of pasta and tinned tomatoes jumps as shop prices rise

The price of pasta, tinned tomatoes and strawberry jam jumped last year as the cost of supermarket staples rose, new figures for the BBC suggest.

Overall, the price of a basket filled with 15 standard food items rose by £#.## or 8%, in just one year.

Changes in the average cost of the food items at Asda, Morrisons, Sainsbury's and Tesco were tracked by retail research firm Assosia.

Some items fell in price, with carrots and mild cheddar seeing small declines.

The same basket of food made up of items from the cheaper "value" ranges at the supermarkets recorded an overall fall in price, down 45p, or 4%. But within that, items such as pasta and vanilla ice cream saw rises of more than 6%.

Other items the firm tracked in the new research for BBC News included tortilla chips, fish fingers, honey, blueberries, carrots and lemons.

Although official figures suggest that the overall cost of living increased by 5.4% in the year to December, this number - known as the inflation rate - can mask some steep rises seen at the tills, especially on everyday items.

There are many factors that can make it difficult to track how prices are changing for households, such as promotions at supermarkets or a lack of availability of certain products.


Questions

1)  Some of the numbers/percentages in the first half of the graphic have been hidden.  Work them out.

2)  There are two errors in the numbers in the second half of the graphic.  Can you spot them without needing to use a calculator?

3)  What is odd about the value range potatoes?

4)  What percentage of the cost of a standard range basket of goods in 2022 is each of the items?

5)  Which of the three products in each range is the most expensive compared to its weight?

6)  If the baskets of goods had only consisted of the three products shown here, what would the percentage change in the cost of the basket have been?

7)  If (from the standard range) you bought an equal weight of spaghetti and potatoes, what would the percentage increase in price be?

8)  The standard range potatoes have increased by 2p and by 2%.  You would expect these two numbers to be the same only if the original price was £1.  Can you explain why it is still possible here?  What is the smallest original price that would mean a 2p increase is also a 2% increase?  What the biggest original price that would work?

9)  What if we wanted an increase of 20p and an increase of 20% ?  What is the smallest price that works?

10) The article mentions some of the items that were used to form the basket of food.  What do you think of their decisions? 


Answers

Q1)  Some of the numbers/percentages in the first half of the graphic have been hidden.  Work them out.  A1)  The original graphic (without the hidden numbers) is below.

Q2)  There are two errors in the numbers in the second half of the graphic.  Can you spot them without needing to use a calculator?  A2)  The total basket has gone from £11.24 to £10.80, which looks like a fall of 44p, but the change is given as 45p.  If the numbers have been rounded to give £11.24 to the nearest penny, but the original values have been used to work out the 45p difference (which is possible) then that means the researchers are using 5 significant figures in their calculations, which seems unlikely to be appropriate/accurate!

If tomatoes going from 28p to 29p gives a 4% increase, then an increase from 27p to 28p in the cost of pasta seems unlikely to be 6%.  (It is actually an increase of 3.7%, compared to the 3.6% for tomatoes.)

Q3)  What is odd about the value range potatoes?  A3)  They cost more than the standard potatoes! 

Q4)  What percentage of the cost of a standard range basket of goods in 2022 is each of the items?  A4)  Pasta is 4%, tomatoes are 3% and potatoes are 6%.

Q5)  Which of the three products in each range is the most expensive compared to its weight?  A5)  In 2022, in the standard range, 1kg of pasta costs 144p, 1kg of tomatoes is 112.5p and 1kg of potatoes is 39.2p (pasta is the most expensive).  In the value range, 1kg of pasta costs 56p, 1kg of tomatoes is 72.5p and 1kg of potatoes is 36.4p (tomatoes are the most expensive). 

Q6)  If the baskets of goods had only consisted of the three products shown here, what would the percentage change in the cost of the basket have been?  A6)  Standard: 18% increase.  Value: 6% decrease.

Q7)  If (from the standard range) you bought an equal weight of spaghetti and potatoes, what would the percentage increase in price be?  A7)  I multiplied the pasta figures by 5 to give the same weight as the potatoes.  The increase is 30.5%.

Q8)  The standard range potatoes have increased by 2p and by 2%.  You would expect these two numbers to be the same only if the original price was £1.  Can you explain why it is still possible here?  What is the smallest original price that would mean a 2p increase is also a 2% increase?  What the biggest original price that would work?   A8)  A 2p increase on 96p is a 2.0833% rise.  This is rounded (reasonably) to 2%.  If the price goes from 80p to 82p then the percentage increase is exactly 2.5%, so 81p is the smallest price that would see a 2p rise also being a 2% (rounded to the nearest whole number) increase.  The biggest price that works is £1.33

Q9)  What if we wanted an increase of 20p and an increase of 20% ?  What is the smallest price that works?  A9)  98p

Q10) The article mentions some of the items that were used to form the basket of food.  What do you think of their decisions?  A10)  I was surprised to see lemons and blueberries were included.  I expected to see the basket include the 15 most common items bought (so apples and bananas might be included?)  Are tortilla chips really more commonly bought than crisps?  

Source: https://www.bbc.co.uk/news/business-60290236

.


Quibans 111: How much energy and water do our AI tools really use?

Here is how I used the article below from the Times.  Before showing the article, I started with this information and these questions: Mic...